Saturday 6 November 2010

A Multi-Level Approach for Modelling & Simulation of Distributed Agent Network

Journal of Algorithms & Computational Technology, Volume 4, No. 3 September 2010, Multi-Science Publishing Co. Ltd


ABSTRACT
The task of building distributed application network is plagued by cost, ambiguous requirements and schedule overrun. A fundamental problem in building distributed applications is the presence of unreliable estimation to formulate the list of requirements in the initial stage of project life cycle. Subsequently, this often leads to reactive response from decision-makers against error occurrences, leaving a very small space for developers to establish forward planning. Unless estimations are enhanced to include more sophisticated verification and validation methodologies, the problem will remain. This paper looks at Petri Nets as a modelling and simulation instrument to verify and validate models of distributed application networks.

1. INTRODUCTION
Historically, life critical software projects have routinely incurred significant checks, simulation and validation in order to reinforce the safety protocols and this approach does now apply also to critical business applications. In attempting to incorporate the simulation strategies in business critical systems, researchers in software engineering have developed several simulation tools with the intention of improving the effectiveness of estimation. An emerging area of research takes into account methodologies such as formal methods. Languages like B- method, pi-calculus and the Z notation [2] provide mathematical formalism to illustrate and evaluate consistencies in software projects.
Building distributed multi-component systems introduces another layer of uncertainty, which very much depends on the underlying network and infrastructure. In this paper we particularly concerned with mobile communication and its infrastructure. The wireless networks with their mobile clients differ from traditional client server models and given that numerous wireless devices are likely to increase [1], the process of integrating those devices under a single server solution can become very complex and inefficient as the network grows. A more practical solution is to operate these mobile devices over a decentralised distributed application system [15]. In this work, the research questions the requirements that exist in building a highly distributed network applications and investigates if simulation can be resourcefully established to examine the model of a particular network. The work focuses on modelling communication agents based on the blueprint of the Virtual Mobile Redirector (VMR) [4] queue structure and subjects it to Petri Nets [3] simulation to carry out a number of experiments. The experiments include several simulation scenarios which when combined together yield an estimation of the agent’s performance and simulating different agents operating in tandem provides a fairly accurate approximation of the network performance.
The paper starts with a brief description of Virtual Mobile Redirector together with the problem domain, and Quality of Service (QOS) issues in a networking environment. Then, the simulation and modelling environment is presented. This is followed by describing the simulation process together with a number of experiments. Finally, we conclude with some suggestions for future work.

2. THE VIRTUAL MOBILE REDIRECTOR
The Virtual Mobile Redirector (VMR) is a multi agent messaging system which enables mobile phones to connect to IP based application through protocol conversion [4]. The application consists of different interconnected software agents, wherein an agent encapsulates a series of methods as one class function and comprises of input/output components expressed as “sensors” with the primary purpose to receiving and dispatching packets of information via queues (sensor class). The agent also contains a processing unit, which identifies which methods are to be triggered when the sensors receive data.
The VMR represents a logical organisation of agents, which interact in a common environment to achieve a particular goal. It focuses on the collaborative resolution of global problem by a set of distributed entities. Like typical Multi Agent System (MAS), the VMR abstracts the interaction between individual agents, defining the independency of the underlying architecture, which can be deployed on both centralised and highly distributed systems. The VMR agents communicate using interconnected queues which are typically the most commonly used data structures within the implementation of communication mediums (substratum) for distributed systems [14]. Queuing theory is the mathematical study of queues within a system which is essentially applied to analyse attributes such as performance, robustness and reliability of multi programmed computer systems.
The VMR architecture has been established on a hierarchical structure of a Multi Agent System (MAS) which can be decomposed into three levels of controls; 1) the agent level, 2) cluster level and 3) system level. Each level has different structures, activities and mechanisms, but the levels interact with each other during local / global communication. The fact that the VMR was designed in a symmetrical and hierarchical manner, it enabled us to design the simulation of the model based on the hierarchical features of Coloured Petri Nets, though the process is not a one to one mapping, it still helped in the design translation process as will be discussed in the following sections.

3. THE PROBLEM DOMAIN AND QUALITY OF SERVICE ISSUES
Simulation aims at observing a system enforced to react under a number of predefined circumstances to finally evaluate the behavioural outcome [6]. A key factor, however, prior to simulation, is to underline what features of the system one needs to simulate in order to maximise knowledge capture with a minimum amount of resources. Considering a distributed application network, at the highest level of observation, the features that a simulator should question are distinguished by five entities [7]. First, for a given network architecture, the task requires knowing the amount of data entering and leaving the system. This is termed as the traffic rate. For example, a network designer is required to decide on the size of a queue component over a network against the traffic rate.
Second, the traffic inside the network may be congested and the designer would be required to know the congestion rate so as to alter the specification of the network for better performance. Third, the rate at which the data is flowing inside the network is also crucial to identify the latency that through simulation can be calibrated to an acceptable level. Fourth, is the throughput; the designer will need to know the delivery rate of the network under different condition. Throughput is usually the first measure that the customer investigates [1]. Finally, data loss is yet another important factor that illustrates how reliable the network system is. The above five entities form the programme’s framework and are termed as the Quality of Service [7] [13].
The Quality of Service of a network is described by its performance, i.e. how efficiently the system delivers its service to the world. Hence, acquiring knowledge on the quality of a system prior to product deployment would be competitive gain for any organisation building network application. We propose that to measure the Quality of Service of a distributed network application at the early stage of development imply the use of simulation tools since a real network system is not available at that level. This can be done using the five entities described earlier; the simulation engine should derive test scenarios to observe the network behaviour and reaction when any of the entities is questioned. The outcome from the simulation is analysed to develop contingencies and self-protecting mechanism when and where required [5]. In this paper we refer to these contingencies as handlers [7]. Each of the entities has their handlers. We hypothesise that a successful simulation procedure should be able to search and locate deficiencies related to the any of the five entities and next propose, with an acceptable degree of error, the appropriate handlers for recovery. The simulation can then test out such a procedure using four different measures to handle the five entities:
(i) Traffic metering to control and monitor traffic rate.
(ii) Resource allocation strategy to boost resource performance should the rate of throughput falls.
(iii) Data drop policy to regulate the rate of data loss.
(iv) Switching / Routing (Re-routing) strategy to alleviate congestion rate over the network.
(v) Resource allocation strategy to reduce network latency.
To evaluate the quality of service of a distributed network application, the experiments should look at three features of performance; namely the entities traffic rate, throughput and latency. The simulation scenarios position the Petri Net model of the network application under different situations whilst the experiments distinctively track the network behaviour and relate the relevant handlers for each situation.

4. THE SIMULATION ENVIRONMENT
In the last three decades research in computer science strongly contributed to the generation of simulation tools. Several formalisms and related automatic tools have been developed, others extended to accommodate simulation engines and are currently available on the market. Within the wide spectrum of simulation techniques, we were required to focuses on a selected subset of simulation tools [8–11], which represents, either for historical reasons or recently achieved popularity, and subsequently choose a platform that best agrees with the basic entities needed to model and simulate a distributed network application, which is Petri Nets in our case.
Petri Nets are a formal modelling technique for the description of concurrent and distributed system behaviour [3]. Since their introduction in the 1960s they have impressively evolved. Currently, several versions of this graphical modelling language exist, which find widespread application in specification, verification, and performance analysis of distributed parallel systems, communication protocols included. Typical applications of Petri Net are in the field of communication protocols, telecommunication networks, and software engineering. Despite a modelling philosophy that is not easy to be acquired,
Petri Nets, with their engaging graphical notation are a powerful modelling language to describe and investigate communicating and resource-sharing processes. Coloured Petri Net combines the basic formalism with programming language CPN ML [3] to enable the creation of accurate system models taking into account temporal and stochastic issues. Similar to other graphical tools, embedding user-defined functions into the specification is an interesting possibility to avoid heavy graphical descriptions of deterministic calculations. For undertaking the experiments, we considered CPN Tools, a freeware Coloured Petri Net tool available on the market. CPN Tools is a new platform for modelling and simulation of Petri Nets, which allows editing, simulating and analysing Coloured Petri Nets (CPN).

5. SIMULATION AND OBSERVATIONS
The models as well as the procedures of the experiments are discussed in this section. The aim is to carry out an investigation as to how Petri Nets are utilised to simulate the VMR multi agent system (VMR MAS) at the highest level and the communication agent queue component at the lowest one. Thus, the information from the exercise can be statistically interpreted so that handlers (contingencies) can be formulated for the necessary QoS measures.
5.1. Modelling and Simulation
When making use of the hierarchical decomposition feature of CPN, we are able to describe the architecture of an agent-distributed system at different level of perceptions. At the highest level of expression, we modelled the incoming of data packets from the external networks to the VMR system which is illustrated in Figure 1.

The CPN model starts with the transition Dispatch receiving one packet at a random time, which follows a Poisson distribution with a mean of 5.0 ms, from an external source. Since the model is a timed Petri Net, variable E at place M is timed in millisecond whilst each packet is numbered at the place TICKER, thus the place Dispatch (P1), knows about the packet number (packetNo). Next, at transition Dispatch, a function ch() is triggered to randomly select between 2 transition operations, either Translate Packet or Decrypt Packet. These functions add more knowledge to the model; hence during simulations more complex processes can be investigated in an attempt to mimic reality as closely as possible. Inside the transitions Translate Packets and Decrypt Packets, there are a series of distinct software agents communicating to each other with a common objective. In the VMR system, operations like “translate the packet structure to a general format” are performed by a cluster of agents. In an attempt to simulate these functions, we constructed a hierarchical transition Translate Packet within which are a group of agents connected to each other, and the same design applies to the transition Decrypt Packet.

Figure 2, depicts the internal design of the transition Translate Packet, wherein, several agents are non-linearly assembled. Packets move concurrently across the agent system which is supported by the CPN infrastructure for such dynamic data movements. An agent receives the packetNo and the arrivalTime from the place DISPATCHED. As the packet travels from one agent to another, the task of translating a message to a generic format is distributed among various agents. Drilling further through the Petri Net hierarchy, we find the design of one agent which triggers several processes towards translating a packet into different formats. However, for simplicity we only present a model of the lowest level of the hierarchy, the FIFO queue sub-net structure (Figure 3), that buffers all the packets that reaches the agent, and which represents the communication medium of each agent, found in the sensor class of the VMR (see section 2). The queue component resides within the sensor class of an agent with the value vh, being dynamic and adjustable during simulation, indicating the top stop mark capacity of the queue’s buffer and when hit, it blocks the packet entry. Unless the buffer is freed, outgoing packets have to wait for their acceptance. Another watermark is the high watermark denoted by h, and when reached, the rate of incoming packet is decreased until the number of packets inside the queue’s buffer reaches the low water mark which indicates that the queue is within normal parameters of operation and no protective measures are required.
When the Transition Packet Arrives is fired, the queue receives a new packet, hence a token is added to the place arrived. Upon arrival, each packet is paired with a number, (see place packet stamped), which contains a time stamp and it is equal to the current model time, created by means of the function timeStamp(), on the arc between Packet Arrives and arrived. The place arrived characterises the packets that reached the queue and are waiting for clearance. Next, the queue pushes the packet into its buffer and the waiting line is shown by the occurrence of the transition PushIntoBuffer.


The arcs between NextPacket and PushIntoBuffer ensure that packets are loaded into the queue in the same order in which they joined which enforces the FIFO structure. When packets are loaded onto the buffer, shown by the place buffered, they are counted (see the inscriptions on the arcs between PushIntoBuffer and buffered, noOfPackets). At this point, packets are inside the buffer and waiting for the next run where the queue might perform some simple processing to the packets before releasing them. Once one packet completes its processing cycle, a token is added to the place leaves. Any claims from the place, causes the transition Claims Packets to be fired which finally state that a packet has left the queue.
The model is an integer-timed Petri Nets, i.e. the queue is processed with relation to time. The Poisson function, at the entry point is used to model the inter-arrival time for packets, and it can be found in the code segment associated with Packet Arrives. By changing the value in the function’s argument, the mean of the Poisson is altered and thus providing different spectrum of simulation conditions. The function CalcAccTime() in the code segment for the transition PushIntoBuffer to calculate how much time is needed for loading a given packet. The function NormDistr() is used to calculate how much time is used for a packet to be processed, as shown in the code segment for Process. This is particularly useful when one needs to make a number of simulations using different parameters.

In summary the objectives of the simulation of the VMR CPN model are as follows:
(i) To observe the percentage time a unit (packet) leaves an agent given a high input rate. This is to probe the information on the throughput of the queue during high input to the VMR system.
(ii) To observe the average time a unit (packet) spends in the VMR System. This is to provide information on the likelihood of out-of-time packet(s), should the latter wait excessively in any queue buffer of any agent.


5.2. Results and Observations
The simulation exercises investigate how packets move amongst the VMR Agents, with variable parameters at different level of hierarchy. The model was fed with packets at random intervals and the output was observed and recorded. The experiments were broken down into two series (experiment 1 & 2).
• Experiment 1 explains that the queues inside the agents resorted to protect themselves whenever the time interval between incoming packets was smaller than the service time of the queue, which consequently resulted in some packets being rejected.
• Experiment 2 stresses on the likelihood of out-of-time packet in the VMR System. This is defined by a function of the agent’s internal latency, queue’s buffer size and the input rate at the receiving end. It confirms that while attempting to gracefully slow down the number of packets entering the buffer, should an overflow occur; the queue inside an agent consequently causes packets to wait longer in its buffer.

Experiment 1 starts by investigating the percentage unit time (ms) a packet leaves the multi agent system given a burst of input. The objective is to observe the throughput of the system in unconditional circumstances and evaluate its behaviour and efficiency to protect itself. We run through three simulations of 4000 steps and at step 1000 , we changed the Poisson mean from 1 packet per 10 ms to 1 packet per 3 ms, which provided the scenario for the burst and is the type of situation common to the domain of messaging. At each simulation we decreased the value of the watermarks, thus decreasing the waiting line in view of achieving conditions where packets have to wait longer to be serviced.


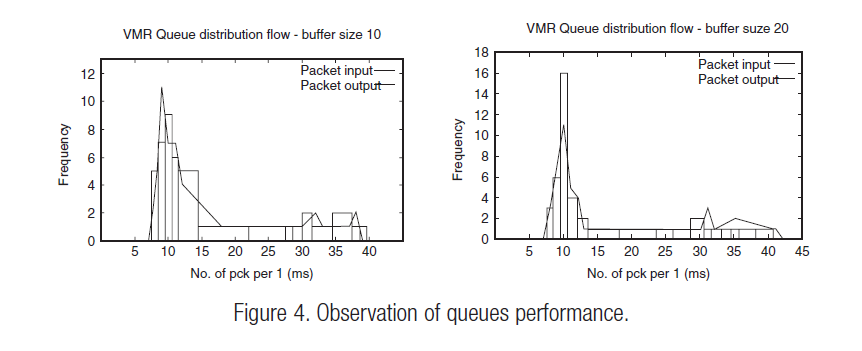
Figure 4 runs through the simulation as the buffer sizes of the queues inside the agents were increased. We sampled the data into batches of 100 ms interval and recorded the number of packets entering and leaving the queue. Given a burst in packet entry, the graph shows the difference between the input rate and the output rate. The close proximity between the input and output rate justifies that that the service rate of queues within the VMR system is adequately lower than the input rate given an input rate of 100 packets per second (1 pck/10 ms) and a burst of approximately 350 packets per second (1 pck/3 ms). The simulation validates both decisions on the buffer size of lower limit 10 and upper limit 20.

In experiment 2 we investigate the period of time a packet stays in the VMR at a given queue of an agent and draws the distribution of the packet’s lifetime. The experiment reports on the time taken for a large sample of packets to leave any queue of an agent. The objective was to estimate the number of out-of-time packet that exists given an input burst and a decrease in the buffer size. We analysed the period of time a packet takes to leave an agent, e.g. over hundred packets take 12 ms to leave the queue of a VMR agent. Hence using such analysis, a threshold can be established to identify the packets that have a probability of being out-of-time when claimed. For instance, should the out-of-time threshold be marked at 15 ms, any packet beyond this mark is irrelevant for the system.

The experiments show how Petri Nets can be exploited to mine appropriate data so that the potential behaviour of a model under a set of parameters can be known. The obtained results provide a very good idea about the performance of the model, hence the formulation of directives prior to product deployment. If we look back at experiment 1 where a discussion on burst of input rate is presented, this is often very true in the mobile telecommunication and messaging systems. For instance, if we consider the message entry to a SMS Centre (SMSC) for one day, there is a pattern, wherein bursts can be found during the morning when people wake up and starts sending text message and burst at lunch time during their break time. To deal with the surge, system designers over-estimate the buffer size of queues within their systems, which is very inefficient in terms of resource allocation and economic viability. However, using simulation based on historical data of typical message distribution, one can provide a range, a lower limit specification size for off peak period and upper limit specification size for peak period. This is type of design is called design for capacity, which is a competitive advantage if possessed. Moreover, the simulation of the VMR model can be used to capture the user requirements at the early stage of the life cycle. This can be done by translating these requirements into the Petri Net simulation model which can help in identifying and observing the different behavioural patterns under different requirements. For example, if the user requirements place an important weight on reliability aspects of QoS, implying the high priority of reducing data loss, resources can be allocated within the model to reflect the importance of this requirement. Moreover, the simulation will provide detailed observations on the impact of increased reliability on other QoS parameters, particularly performance, as well as its impact on resource allocations i.e. cost. Thus, such observations provide more knowledge to enforce better accuracy for quality estimations, in terms of QoS.

6. CONCLUSIONS
The paper presented an approach for modelling and simulation a multi-agent messaging system (VMR) using multi-level Petri Net formalism and CPN Tools. The paper also presented the potential of capturing and estimating the user requirements at the early stage of the software life cycle. As it can be observed, Petri Net is an adaptable tool, i.e. it allows alterations to a model so as to retrieve the necessary information from it. Two experiments were conducted to show how simulation can be executed to question a model. The results and observations provided more knowledge to enforce better accuracy to estimations particularly at the early stages. In terms of QoS, it shows how Petri Nets can be exploited to mine appropriate data so that the potential behaviour of a model under a set of parameters can be known. The obtained results provide a good idea about the performance of the model prior to product deployment.

REFERENCES
1. Price Water House Cooper, “Technology Forecast: 2009”, 2009.
2. J. M. Wing, “A Specifier’s Introduction to Formal Methods”, IEEE Computer, vol. 23, 1990.
3. Kurt Jensen, “Coloured Petri Net – Basic Concepts, Analysis Methods and Practical Use ”, Vol 1, 2nd Edition, Springer, 1997.
4. Empower Interactive Group Ltd, “Virtual Mobile Redirector Manual Guide”, 2003.
5. Roger S. Pressman, “Software Engineering, A Practitoner’s Approach”, 5th Edition, McGrawHill, 2000.
6. Cisco Systems, “IP Quality of Service, – The complete resource for understanding and deploying IP quality of service for cisco networks”, Cisco Press, 2004.
7. J. Ellsberger, D. Hogrefe, and A. Sarma, SDL Formal Object Oriented Language for Communication Systems, Prentice Hall, 1997.
8. C-M. Huang and J-M. Hsu, “An Estelle-Based Probabilistic Partial Timed Protocol Verification System,” Int’l. Conf. Parallel and Distributed Systems, 2004.
9. T. Bolognesi and E. Brinskma, “Introduction to the ISO Specification Language LOTOS,” Computer Networks and ISDN Systems, vol. 14, Apr. 1987.
10. L. Millett and T. Teitelbaum, “Slicing Promela and Its Applications to Protocol Understanding and Analysis,” Proc. 4th SPIN Wksp., Paris, France, 1998.
11. Nam, S.Y., Sung, D.K., “Measurement Based Delay Performance Estimation in ATM Networks”, Globecom, 2000, pp. 1766–70.
12. Mouharam, A.A.K., “Monitoring Quality of Service on Broadband Networks”, PhD Thesis, Kingston University, 2002.
13. Makoond, B, “An Integrated Modelling Framework for the Design and Constructions of Distributed Messaging Systems”, PhD Thesis, Kingston University, 2008.
14. Khaddaj S, B Makoond and R Oudrhiri, “Distributed Computing Techniques for Wireless Messaging Systems” in ‘Journal of Algorithms and Computational Technology’, Multi-Science Publishing Co Ltd, 2008, pp. 1748–3018. Journal of Algorithms & Computational Technology Vol. 4 No. 3 323

Thursday 18 March 2010

The Adoption of Testable Architecture to Model Service Discovery Mechanism within a Distributed system

Overview
This paper reports on the study that has been carried out on the process of designing the capability of service discovery within the mechanics of a distributed architecture to supports the paradigm of service oriented. Using classical software modelling tools, the ability to model discovery capabilities is constrained due to the static nature of the tools. We are required to adopt the approach of inductive modelling discipline, i.e. the formulation of dynamic models in order to test the model against a yield that conforms to the dynamic nature of distributed behaviours during the act of communicating. Service discovery is typically a dynamic facet of distributed models and due to the fact that there are different discovery approaches, we need to know, upfront, which ones best conform to the character of the distributed model one is planning to build. Testable architecture (TA), with its advances to accomodate the formalism of Coloured Petri Nets, to complement pi-calculus provide the neccessary framework and mathematical rigour to model the dynamism of service discovery before any lines of codes have to be created. This helps to reduce the cost of development by reducing the rate of defect injections, from design to build, since the phenomenon of emergent behaviours amongst communicating behaviours can be tested and be revealed at the early stage of the Software Development Life Cycle (SDLC). In our study we exploit TA to provide us with a simulation environment in order to model and test the dynamic behaviours of distributed systems for the problematic of service discovery.

Service Discovery
The word discovery, as the oxford dictionary illustrates, is the act or process of finding out or becoming aware of what was yet not found (Oxf03). In the context of the network engineering, service discovery is a method of determining and instantiating the resources required to manage and operate network entities and their associated software composition. The latter are often deployed across multiple nodes within a cluster and communicate with each other to mutually form a series of defined services. Existing models to service discovery have been developed primarily for fixed network backbone environments and typically rely on centralised components being accessible to potential service clients at any given time (Gutt99, Arn99 and Mic99). In highly dynamic nature of underlying network topology, these models lack the designated service infrastructures, hence rendering such discovery mechanisms unsuitable for ad hoc environments. The concept of service discovery is well established in distributed systems, since networked entities need to discover available remote resources (Mull85). Work on service discovery focus on using decentralised architectures to overcome the limitations of traditional discovery mechanisms, such as Service Location Protocol (SLP) (Gutt99), Jini (Arn99) and UPnP (Mic99), which rely on fixed infrastructure. Research in service discovery architectures for mobile environments can be classified into lower layer service discovery protocols (Haa99, li00 Xue01 and Koz03) and higher-layer service platforms (Herm00, Chak02 and Hel02). Service discovery protocols emphasise on efficiency and distributed infrastructure while service platforms focus on providing a middleware layer that enables applications to use a service oriented programming model. The reader should note that the works carried out on service discovery architectures, (Zhu02, Cho05 and Enge05), provide a survey and an evaluation analysis of different service discovery models.

In our study we place emphasis on the higher layer service platform, with the objective of designing and simulating the different service discovery strategies in the context of distributed messaging services. The aim is to model and build fast and robust service discovery strategies, which are the main drivers for efficient management and organisation of distributed system.

Structure & Data Model
The data model explains the relationships between the known entities, showing how services are provided by a given application (see Figure 1). It also shows how the participants or software components and the physical nodes relate to each other within a cluster by means of service discovery strategies.

Figure 1 ERD of Service Discovery Model
The Entity Relationship Diagram (ERD) in Figure 1, shows that the entity Service Discovery Strategy has many types, (entity Types) which defines the properties of a distinct strategy and the cluster of nodes they manage. The purpose of the Service Discovery Strategy is to locate a particular service, represented by the association search for entity Service. This association will define the route, shown by entity Route, which will be used by a node to process a particular service. The entity Route describes the connectivity model between nodes and associated services.

The Communication Model of Service Discovery
The communication model for the purpose of service discovery explains two essential concepts.
Communication Agreement Model
The communication agreement model describes the five distinct states of affairs during the deployment and run time of a cluster of services. It shows that there are defined sequences of operations at a distinct phase of the network life cycle. The five communication agreement models are as follows:
o Cluster Establishment (CE)
o Cluster Maintenance (CM)
o Service Agent Establishment (SAEST)
o Service Agent Enablement (SAEN)
o Service Agent Maintenance (SAM)
Communication Styles
The communication style defines the manner in which information is exchanged and how it determines the service discovery strategy. We considered the four most common strategies of service discovery:
o Exhaustive search
o Broadcast All acknowledge
o Broadcast 1 acknowledge
o Transactional publish subscribe
The hypothesis states that the implementation of a particular communication style depends on the type of communication agreement model in place which implies that using only one type of service discovery strategy e.g. broadcast, to manage all types of communication agreement models may be not efficient and eventually implausible to manage as the system evolves. The study has been designed to validate the hypothesis and applies a blended modelling approach to join simulation models with the qualitative modelling techniques.
Communication Agreement Model
The communication agreement model represents the distinct states of a cluster within a defined life cycle. It holds a collection of operations which are enforced by a cluster manager in order to start, run and maintain a system. We have identified 5 distinct collections of operations and each of them is carried out using one or more service discovery strategies. Subject to the type of operations in place and the state of a cluster, each of the service discovery strategies has different properties influencing the overall quality of a system.
Cluster Establishment
In order for a cluster to be established, the service manager initiates the start-up sequence within a physical node, and attempts to discover the availability of other nodes within the cluster (see Figure 2). It establishes a communication channel between each active node and these allow for the transfer of heartbeats between Service Managers as well as updates regarding service agent establishment and service agent maintenance messages across the cluster. If more than one service manager is active, a mechanism should determine a Master Service Manager for the Cluster and information from the master should be distributed to Slave Service Managers. Both master and slave service managers are Local Service Managers for their respective nodes. Should no other service managers be found during the start-up sequence, the started service manager begins service agent establishment.

Figure 2 Cluster Establishment

Cluster Maintenance
In order for a Cluster to be maintained, the master service manager should be capable of handling the introduction and removal of slave service managers (essentially the addition or removal of nodes from the cluster). Should the master service manager fail, one of the remaining (if any) slave service managers should adopt the role of a master service manager. This may result in service agent establishment, enablement and maintenance as necessary which are described below.
Service Agent Establishment
In order for a Cluster to be fully functional, the Local Service Manager should be capable of starting Service Agents upon the node as determined by the Master Service Manager (see Figure 3). The Local Service manager controls different types of service agents which are responsible for distinct tasks. For instance a particular Service agent may be responsible for managing the connection to external entities such as Billing Platforms, whereas others are responsible for Customer Data Managements.

Figure 3 Service Agent Establishment

Service Agent Enablement
Service agent enablement is the process wherein the local service managers, instantiate service agents on individual nodes and report the start-up status to the master service manager. The master service manager will then issue routing information to the local service managers, which is then propagated to the service agents on each node. The master service Manager upon validation that the minimum required agent base is available to run an application instance e.g. an underwriting workflow, should issue a signal to the local service managers to inform the service components to initiates business process. Figure 4, shows an example of service agent communication across a cluster and the communication channels between service agents. The communication between the service managers’ communication and service agents is not shown for diagram simplicity.

Figure 4 Service Agent Enablement

Service Agent Maintenance
Service agent maintenance is performed by a local service manager and is responsible for handling the start-up and shutdown of service agents as determined by the master service manager. The Local Service Manager is also responsible for reporting to the Master Service manager any failure of a Service Agent so that it can be instantiated elsewhere within the cluster.

Communication Styles

We define communication styles as the ways or manner information is conveyed across dispersed nodes within a cluster. The communication styles are the different strategies applied to locate and instantiate services within a cluster of services. As mentioned earlier, the discovery strategies are available with various properties and can be broken down into the following categories:
Exhaustive Search Strategy
Exhaustive search is a brute force method where a service polls for information against the known services until the desired response is received (see Figure 5).


Figure 5 Operational Model of the Exhaustive Search Strategy

With an exhaustive search any service will iteratively poll other services starting with the first, wait for a response and if the result is negative will continue to the second and await its response until such time as the desired response is obtained or no further services to be polled remain.

Broadcast Strategy
Broadcast discovery is a method where a polling service broadcasts a request to a number of services in order to receive a response. This is normally an information request or a request for something to be processed. There are two models which can be considered:

Broadcast (All Respond)
With the “Broadcast All Respond” model, all services that can possibly handle a request are transmitted and each polled service issues a request response (see Figure 6). This request response can be either a positive response indicating a service has been performed successfully or an information response passing data to the polling service. It can also be a negative response indicating that the service request cannot be performed or the information requested is not available or accessible by the polled service. The polling service should have a timeout mechanism if only unsuccessful responses or no response be forthcoming.


Figure 6 Operational Model of the Broadcast Strategy

Broadcast (Active Respond)
With the “Broadcast Active Respond” model (see Figure 7), all services that can possibly handle a service request are transmitted however only polled services that can issue a positive response indicating a service has been performed successfully or return data to the polling service, responds. All other services continue as if the service request was never received. The polling service should have a timeout mechanism if no response be forthcoming.


Figure 7 Operational Model of the Broadcast Active Respond Strategy

Transactional Publish Subscribe Strategy
The “Transactional Publish/Subscribe” method involves publishing a service request to a list (see Figure 8). The service request list is a FIFO list and any servicing entity may remove the first request from a list, however only one service may subscribe to process a single service request. Upon completion of a service request the servicing entity sends its response to the Posting service. It is possible to have multiple posting services publishing to the same service list. The posting service should have a timeout mechanism to recover if a response to a published request is not forthcoming.


Figure 8 Operational Model of the TP Subscribe Strategy

As part of the “Transactional Publish/Subscribe” method the question arises as to where the location of a service list resides and if the list should have local copies (caches) located across the cluster rather than in a central location. The relevance of whether a local cache is advantageous depends on the nature of the data stored within the service list. Data which has a short life span is less suitable for caching locally than data that has a longer life span. Also data that requires constant updating is less suitable to local caching than any data that has a fixed value. The reason for this is that constant updating of the primary list affects all cached lists and updating of the local caches requires significantly more resources than simply the maintenance of the primary list. As the number of caches increases so does the amount of required resources to maintain them.
All the above discussed strategies, share a common format in that services expose an availability notice to the service discovery element and running services communicate to each other using one or more of the strategies mentioned.

Simulation Model

In this section we demonstrate the use of TA to formulate the dynamic Petri Net models of service discovery mechanism so as to validate which discovery strategy best conforms to the SLAs and quality requirements of the system. As mentioned earlier, there are five communication agreement models that define the state of a cluster within a life cycle. The following sections show the characteristics of the communication agreement models to understand the frequency of their occurrences within the life cycle of a cluster and to test each service discovery strategy (communication style) against each of the communication agreement models.

Cluster Establishment
Cluster establishment happens once in the system life cycle, at initialising time. There are several service managers and each manager is required to know about their neighbouring services. The simulation performs a many to many relationships between the service managers wherein all service discovery strategies compete with each other to find the best strategy for service discovery at that level.

Cluster Maintenance
Cluster Maintenance occurs periodically during the system life cycle. At run time, the master service manager communicates with the slave service managers to check their existence through distinct “heart beats” which is configurable. This process maintains a quorum defining the instance of a cluster, where the communication is based on one-to-many relationships.

Service Agent Establishment
Service agent establishment happens once during the system life cycle, when a cluster is established and its boundary is defined. The next operation is to identify and initiate the service agents within the cluster. The service managers communicate with the service agents, which is based on one-to-many relationships.

Service Agent Enablement
Service agent enablement happens once during the system life cycle. It concludes the final phase of initialising the service agents, after all the services have been established. In our scenario, the service enablement process will cluster all the related service agents to formulate a particular instance of a messaging gateway application. This is a many to many communication style of service discovery.

Service Agent Maintenance
Service agent maintenance occurs periodically during the system life cycle. In this state, service agents are connected and communicate to complete a typical service. During this operation, some information might be required from service agents, thus triggering service discovery, which is a many to many communication style of service discovery.

We observe that service discovery mechanisms are implemented at different states of a cluster life cycle and also that it is used at two phases of execution; 1) at initialisation time – frequency of occurrence is once, 2) during run time – frequency of occurrence is periodical.
In order to simulate the different service discovery scenarios, the high level description of the proposed communication styles are translated into a dynamic Petri Nets model.

The Broadcast Strategy
Figure 9, shows a number of configurable Places representing individual agents, where each of them has two states, ready and performing, depicted by the place Agent. When the simulation starts, the transition SendMessage is fired to broadcast discovery requests to all the clustered agents. The post condition of such flow is defined by the place sent which is of type TimedMSG. A message therefore, consists of a source and a destination. When a message is sent, the destination agents receive those messages which enable the transition ReceiveDTMessage to occur, firing the place received. On receipt, the agents process the message, shown by the transition ProcessMessage and acknowledges to the source which is done by firing the transition SendAcknowledgement. The place ack explains that the source agent has received an acknowledgement, i.e. the transition ReceivedAcknowledgement is fired. This ends the first round of broadcast strategy and another process with a different source is initiated. Figure 9 describes the discovery traffic that occurs during a broadcast where the Petri Nets distinguish between the application traffic and the network traffic. Application traffic is any type of traffic that is not related to service discovery but can request an initiation of service discovery. An analogy is a service agent dedicated to storage and its objective is to read from and write to databases. So the reading and writing of data exchange occurs over the application traffic.

Figure 9 CPN Model of the Broadcast Strategy

In Figure 9, there is a producer of events that causes application traffic by assigning a message for agent. When a message arrives, an agent fires the transition ReceivedNTMessage. Consequently the place arrived shows a message exist and an agent needs to process the message. The transition ProcessMessage is triggered and the place processed contains a resource which is a message. The final phase of the system is the transition Execute that occurs when the message leaves the system. Therefore the model allows agents to handle both application traffic and discovery traffic. The impact of network traffic over application traffic provides a key indicator of throughput performance which can be observed through simulation.

The Transactional Publish Subscribe Strategy
Figure 10 shows some similarities in the design of the broadcast and the Transactional Publish Subscribe (TPS). Transitions such as ReceiveDT/NTMessage, ProcessMessage and Execute perform the same tasks as described in the broadcast model. However, there exist an agent pools where agents are able to subscribe to a service for publishing information on a board. This is depicted by the transition SubscribeAgent, which after successfully subscribing to the board, represented by the place subscribed, the agents enters a FIFO queue, EnterAgentQueue and goes to the ready state, shown by the place ready. When the agents are in the ready state, three things may happen; 1) the agent may be a source and publish information on the board which will consequently fire the transition SendMessage; 2) The agent may be a destination and receives discovery traffic, shown by the transition ReceiveDTMessage, or 3) the agent may also be a handler which handles application traffic when a message event occurs.


Figure 10 CPN Model of the TPS Strategy

The Exhaustive Search Strategy
The Exhaustive search model (see Figure 11) is again very similar to the broadcast model. The difference is that in exhaustive search, the message from the transition SendMessage is not publicised. Here only, one message leaves the transition SendMessage and one destination agent receives it, shown by transition ReceiveDTMessage. The source agent will not send another message until it receives an acknowledgement from the destination agent. The place wake & sleep allows an agent to send a message but it needs to wait until it receives an acknowledgement from the destination to be able to ask another agent.


Figure 11 CPN Model of the Exhaustive Search Strategy

Application of Service Discovery Strategies to a typical Messaging Scenario
This section introduces a scenario, which attempts to position the concept of simulation and dynamic modelling into a real life situation of distributed messaging services. The process is called a Delivery Request which is a work flow model, designed to represent that a SMSC requires an acknowledgement that a message has been delivered to an IP based application. The objective of the simulation scenario is to find out which service discovery strategy (communication style) best conforms to the specifications of this particular work flow.

When the simulation starts, a transition ApplicationSendMSG sends message to the system, hence the place arrived indicates that a message has reached the system (see Figure 12). Upon arrival, the message is processed i.e. an agent is assigned to the message, resulting to the transition ProcessMessage to be fired. Each message has a ticketNo which is checked by the agent to know which SMSC the message is ought to be sent. If the agent does not know about the message, it finds it by triggering a service discovery mechanism. As mentioned there are three types of strategy, Broadcast (all respond / active respond); Transactional Publish Subscribe; Exhaustive Search. When an agent who knows about the existence of the message is found, it sends an acknowledgement to the sender, shown by the transition sendAcknowledgement. The sender receives the acknowledgement and fires the transition ReceiveAcknowledgement. Next the sender sends the message to the destination agent which is depicted by the transition SendMessageToAgent. The agent then sends the message to the committed SMSC, shown by the transition DeliverToSMSC. The Petri Net model was simulated wherein each service discovery strategy proposed was submitted to the test for a delivery request.


Figure 12 CPN Model of Delivery Request Model in Messaging

Observations
A cluster is complete after the service agent enablement state has been reached, thus all the service agents, that are required to complete a distinct messaging gateway application, are enabled. The service managers are responsible for one or more service agents. In order to establish a messaging gateway, the service managers need to find out about themselves and ask each other the type of service hosted.
We looked at the generic model of broadcasting, exhaustive search and transactional publish subscribe. Three simulations of 30,000 steps with one millisecond interval each, were executed. We change the agent population from 4 to 20 units for each simulation to address the quality attribute of Scalability. The first scenario considered was the process of establishing a cluster, referred to as the cluster establishment. After the simulation, we tested for the normality of the observed results, then conducted a 2 sample T Test (Park07) on the service discovery message processed per unit time. We then compared which strategy has a greater mean for message processed per second, i.e. the speed for processing service discovery message relating to the quality attribute of Performance.


Figure 13 Individual Value Plot of Broadcast vs. TPS Strategies

We plot the service discovery packet processed per millisecond of the broadcast strategy against the Transactional Publish Subscribe (TPS). We observed that the mean message processed per second of Broadcast is bigger than the one of TPS. The distribution shows that the Broadcast strategy allowed more messages per second to be processed by destination agents rather than TPS. Hence the likelihood of Broadcast strategy finding a bigger population of agents within a period of time in a system is greater than TPS. However, the standard deviation of Broadcast against its mean is bigger than that of the TPS where the individual plots are more crowded around the mean (see Figure 13). Yet the distribution of TPS is steadier which shows that the overall network traffic is more stable and reliable. This is understandable since within the TPS model, there exist a FIFO queuing model allowing only one agent to process only one message for each simulation turn and if there is a burst of incoming message, the message waits in the queue’s buffer instead of flooding the system. TPS provides reliable network mode, yet the drawback for such strategy is that message may pile up at the queue, and messages have to wait longer than, perhaps, the defined Service Level Agreement (SLA). The flexibility of such system lies on how elastic the FIFO queue is, i.e. dynamic adjustment of its buffer. When compared to the Transactional Publish Subscribe strategy, Exhaustive Search really shows that very few messages are processed per second, thus exhibiting poor performance. As the number of agents scaled up, the performance dropped drastically (see Figure 14).

Figure 14 Individual Value Plot of TPS vs. Exhaustive Strategies

So both performance and scalability were poor for the Exhaustive Search strategy. We can understand that because in exhaustive search, when the source is looking for a destination agent, he waits idly for an acknowledgement and then search for the following agents, and so on, thus within a given time period, less discovery message is processed. However, with the exhaustive search strategy, the process to looking for a service and waiting for an answer make the strategy more robust, which addresses the quality attribute of Robustness. Should the reply from the destination agent be critical and necessary, we demonstrate that the exhaustive search strategy provides more robust solutions.
In Figure 15, the Box plot of the broadcast strategy against the transactional publish subscribe strategy, is another representation of the number of message processed per second. The area of the Box Plot for Broadcast is larger than TPS and it shows the weight of the distribution for message processed per unit time against TPS. So far, we found that the Broadcast is faster in processing service discovery message per a given unit time than TPS but TPS is faster than Exhaustive Search. What is required to understand is how the three service discovery strategies influence the application traffic of the network. When sampling data for the T Test of application traffic, we observed that there were not sufficient data points for the broadcast strategy. This is due to the fact that compared to the other two service discovery strategies, the broadcast strategy processes far too little of the application traffic. This is logical and observable when we increased the number of agents in the CPN model to 20 agents; a broadcast strategy floods the system with service discovery messages leaving very few agents idle to process application traffic. This is the case when there is no network separation between application and service discovery traffic.


Figure 15 Box plot of Broadcast vs. TPS Strategies

Figure 16 shows a graphical visualisation of application traffic processing between the broadcast TPS strategies.


Figure 16 Throughput Performance of TPS vs. Broadcast Strategies

The result of the analysis compares the throughput performance of application traffic of two systems, one using a broadcast strategy for service discovery, and the other utilises transactional publish subscribe (TPS) method with each system hosting 20 software agents. It can be observed, that the worst case of deprivation for application traffic is when the broadcast strategy is implemented. Using the transactional publish subscribe strategy application traffic performance was observed to be much higher. We applied a two sample T test (Park07) to compare the mean of the number of application traffic messages processed per second for the transactional publish subscribe and exhaustive search strategies (see Figure 17).


Figure 17 Individual Plot of Exhaustive Search vs. TPS Strategies

We observed that the exhaustive strategy processes more of the application traffic than the TPS strategy. This is true because, within the Exhaustive Search strategy, one agent sends a discovery message and waits for an acknowledgement. While waiting, it is idle to carry out its application traffic, hence increasing the flow of application traffic in the system. However, if we look at transactional publish subscribe we see that the distribution of application traffic in Figure 17 is similar to the distribution of discovery traffic in Figure 13. This demonstrates that the transactional publish subscribe method more or less uniformly shares the load of application traffic and service discovery traffic that is essential to support high scalability. Figure 18 shows the comparisons of all three Service Discovery strategies applied for the single problem of Delivery Request (see Figure 12).


Figure 18 Broadcast, Exhaustive Search and TPS strategies in a Delivery Request Scenario

The metric used to draw the graph, in Figure 18, is the cumulated probability that a packet is delivered within 10 millisecond of its arrival. This graph compares the mean evolution of the probability for all three service discovery strategies and shows their performance. The ideal system would guarantee a mean of 1. As we can observe, the broadcast strategy is closer to 1 than the other two service discovery strategies. This is possible because the Petri Net in Figure 12 models the agents as a multi-threaded system and can run service discovery traffic and application traffic concurrently. That model makes the assumption that service discovery and application traffic run on separate networks which implies that the broadcast service discovery strategy has a higher probability of delivering a packet within a small time of its arrival on a multi-threaded model dichotomising the application traffic with the Service Discovery Traffic. However, we did that at a cost of introducing a new problem of economics, since threads consumes CPU processing time (resources).
Figure 19 shows the ratio of packet delivery over packet arrival within 10 ms and allows packet forwarding should the ratio be outside the 10 ms timeframe. This occurs when packets are not delivered in turn but wait in the system and are delivered in the next or next + n turn. The Box plot shows the performance and reliability of each strategy for delivery request. The standard deviation tells us that transactional publish subscribe is steadier for service discovery per message and the least steady is broadcast.

Figure 19 Box plot of Broadcast, Exhaustive Search and TPS strategies

So far what we have observed is that:
-Broadcast is faster than the other two strategies to discover new services
-Broadcast deprives the system from application traffic since the system is overwhelmed with discovery traffic.
- TPS more or less shares the application traffic and discovery traffic uniformly.
- TPS allows the system to run at a steady state due to the FIFO queue.
- ES allows more application traffic in the system and minimises discovery traffic.
On the grounds of our finding, we see that one service discovery strategy alone cannot conform to all requirements of the communication agreement models within a given distributed service model. At each phase of the communication life cycle a blended service discovery model is required as summarised in Table 1.

Table 1 Observational Matrix of the Service Discovery Model

Conclusion
We demonstrated how different service discovery strategies work across distributed nodes and how they influence the choice of communication styles. The results of the experiments demonstrated that one service discovery strategy alone cannot provide full compliance to the overall system requirements. This means that at various stages of system life cycle enacting different workflows or business processes, different types of service discovery strategies have to be implemented in order to manage the nodes. To know which strategy to use, we have to look at the characteristics and CTQs which are essential for that particular communication agreement model. The example that was considered shows that to establish a cluster of nodes, one of the CTQs is performance and one of the characteristics is the occurrence of that process. In this case the observational results illustrate that the Broadcast strategy matches the criteria and should be implemented as far as performance is concerned. Moreover, we also showed that the Broadcast strategy overwhelms the network traffic and is not recommended during high volume of application traffic. Since establishing a cluster happens only once during the system life cycle, prior to any application traffic, the strategy conforms to the characteristic of the communication agreement model. We have shown that this type of knowledge and study can only be obtained through dynamic modelling techniques and indeed such knowledge has been acquired from the simulation of Testable Architecture.

(Oxf03) Oxford University, “Oxford Dictionary of ENGLISH”, Oxford University Press, 2Rev Ed edition, August 2003
(Gutt99) Guttman E, Perkins C, Veizades J, Day M, “Service Location Protocol, Version 2”, IETF, 1999
(Arn99) Arnold K, Scheifler R, Waldo J, O'Sullivan B, Wollrath A, “Jini Specification”, Addison-Wesley Longman Publishing Co., 1999
(Mic99) Microsoft Corporation, “Universal Plug and Play: Background”, Microsoft Corporation, 1999(Mull85)
(Haa99) Haas Z J, Liang B, “Ad-Hoc Mobility Management with Randomized Database Groups”, in Proceedings of the IEEE International Conference on Communication, IEEE Computer Society, pp. 1756-1762, 1999
(li00) Li J, Jannotti J, Couto D S J D, Karger D R, Morris R, “A Scalable Location Service for Geographic Ad Hoc Routing”, in Proceedings of the 6th Annual International Conference on Mobile Computing and Networking, ACM Press, pp. 120-130, Boston, Massachusetts, USA, 2000
(Xue01) Xue Y, Li B, Nahrstedt K, “A Scalable Location Management Scheme in Mobile Ad-Hoc Networks”, in Proceedings of the 26th Annual IEEE Conference on Local Computer Networks: IEEE Computer Society, pp. 102-112, 2001
(Koz03) Kozat U C, Tassiulas L, “Network Layer Support for Service Discovery in Mobile Ad Hoc Networks”, in Proceedings of IEEE INFOCOM, vol. 23, IEEE Computer Society, pp. 1965-1975, 2003
(Herm00) Hermann R, Husemann D, Moser M, Nidd M, Rohner C, Schade A, “DEAPspace: Transient Ad-Hoc Networking of Pervasive Devices”, in Proc.of the 1st ACM International Symposium on Mobile Ad Hoc Networking & Computing, IEEE Press, pp. 133-134, Boston, Massachusetts, USA, 2000
(Chak02) Chakraborty D, Joshi A, Finin T, Yesha Y, “GSD: A Novel Group Based Service Discovery Protocol for MANETS”, in Proceedings of the 4th IEEE Conference on Mobile and Wireless Communications Networks,MWCN, IEEE Press, Stockholm, Sweden, 2002
(Hel02) Helal S, Desai N, Verma V, Lee C, “Konark: A Service Discovery and Delivery Protocol for Ad-hoc Networks”, in Proceedings of the 3rd IEEE Conference on Wireless Communication Networks WCNC, IEEE Press, New Orleans, USA:, 2002
(Zhu02) Zhu F, Mutka M, Ni L, “Classification of Service Discovery in Pervasive Computing Environments”, MSU-CSE-02-24, Michigan State University, 2002
(Cho05) Cho C, Lee D, “Survey of Service Discovery Architectures for Mobile Ad hoc Networks”, Mobile Computing, CEN 5531, Department of Computer and Information Science and Engineering, CICE, University of Florida, 2005
(Enge05) Engelstad P E, Zheng Y, “Evaluation of Service Discovery Architectures for Mobile Ad Hoc Networks, in Proceedings of the 2nd Annual Conference on Wireless On-demand Network Systems and Services, WONS, 2005
(Park07) Park H M, "Comparing Group Means: The T-test and One-way ANOVA Using Stata, SAS, and SPSS", Indiana University, 2007